Lesson Plan Title : Jelly Bean Preferences
Age Range: Kindergarten through grade 2 (Primary)
Overview and Purpose: In this activity, students have fun creating different graphs based on a bag of jellybeans. They find out which jellybeans their friends like the best and the least and use this information to create a graph.
Objective: The student will be able to create a graph showing how many people like each kind of jellybean.
Resources:
Bag of jellybeans
Chart paper with the outline of a graph on it
Markers
Activities:
Give each student one of each kind of jelly bean. Have them try each one and rank them in order from their favorite to their least favorite. Then have the students help you complete the chart by filling in the square above which jelly bean they liked best. You could then divide the students into groups and have them create charts based on least favorite, sweetest, or chewiest jellybean.
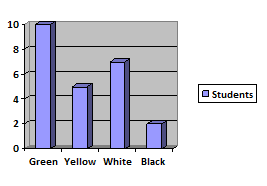
Sample Graph of Favorite Jelly Beans
Wrap Up:
Students could continue this activity at home by finding out which jellybeans their family likes the best.